Annual Sales Report Spreadsheet Template
Download Annual Sales Report Spreadsheet Template
Microsoft Excel | Google Sheets
Use this template, which comes in a simple spreadsheet format, to track and report sales data. Compile sales information over a single year; list monthly, quarterly, and yearly totals; and forecast sales revenue based on previous trends. Add this template to year-end financial reports to give stakeholders a detailed look at your sales performance.
Year-End Sales Report Template
Download Year-End Sales Report Template
Microsoft Word | Adobe PDF | Microsoft PowerPoint
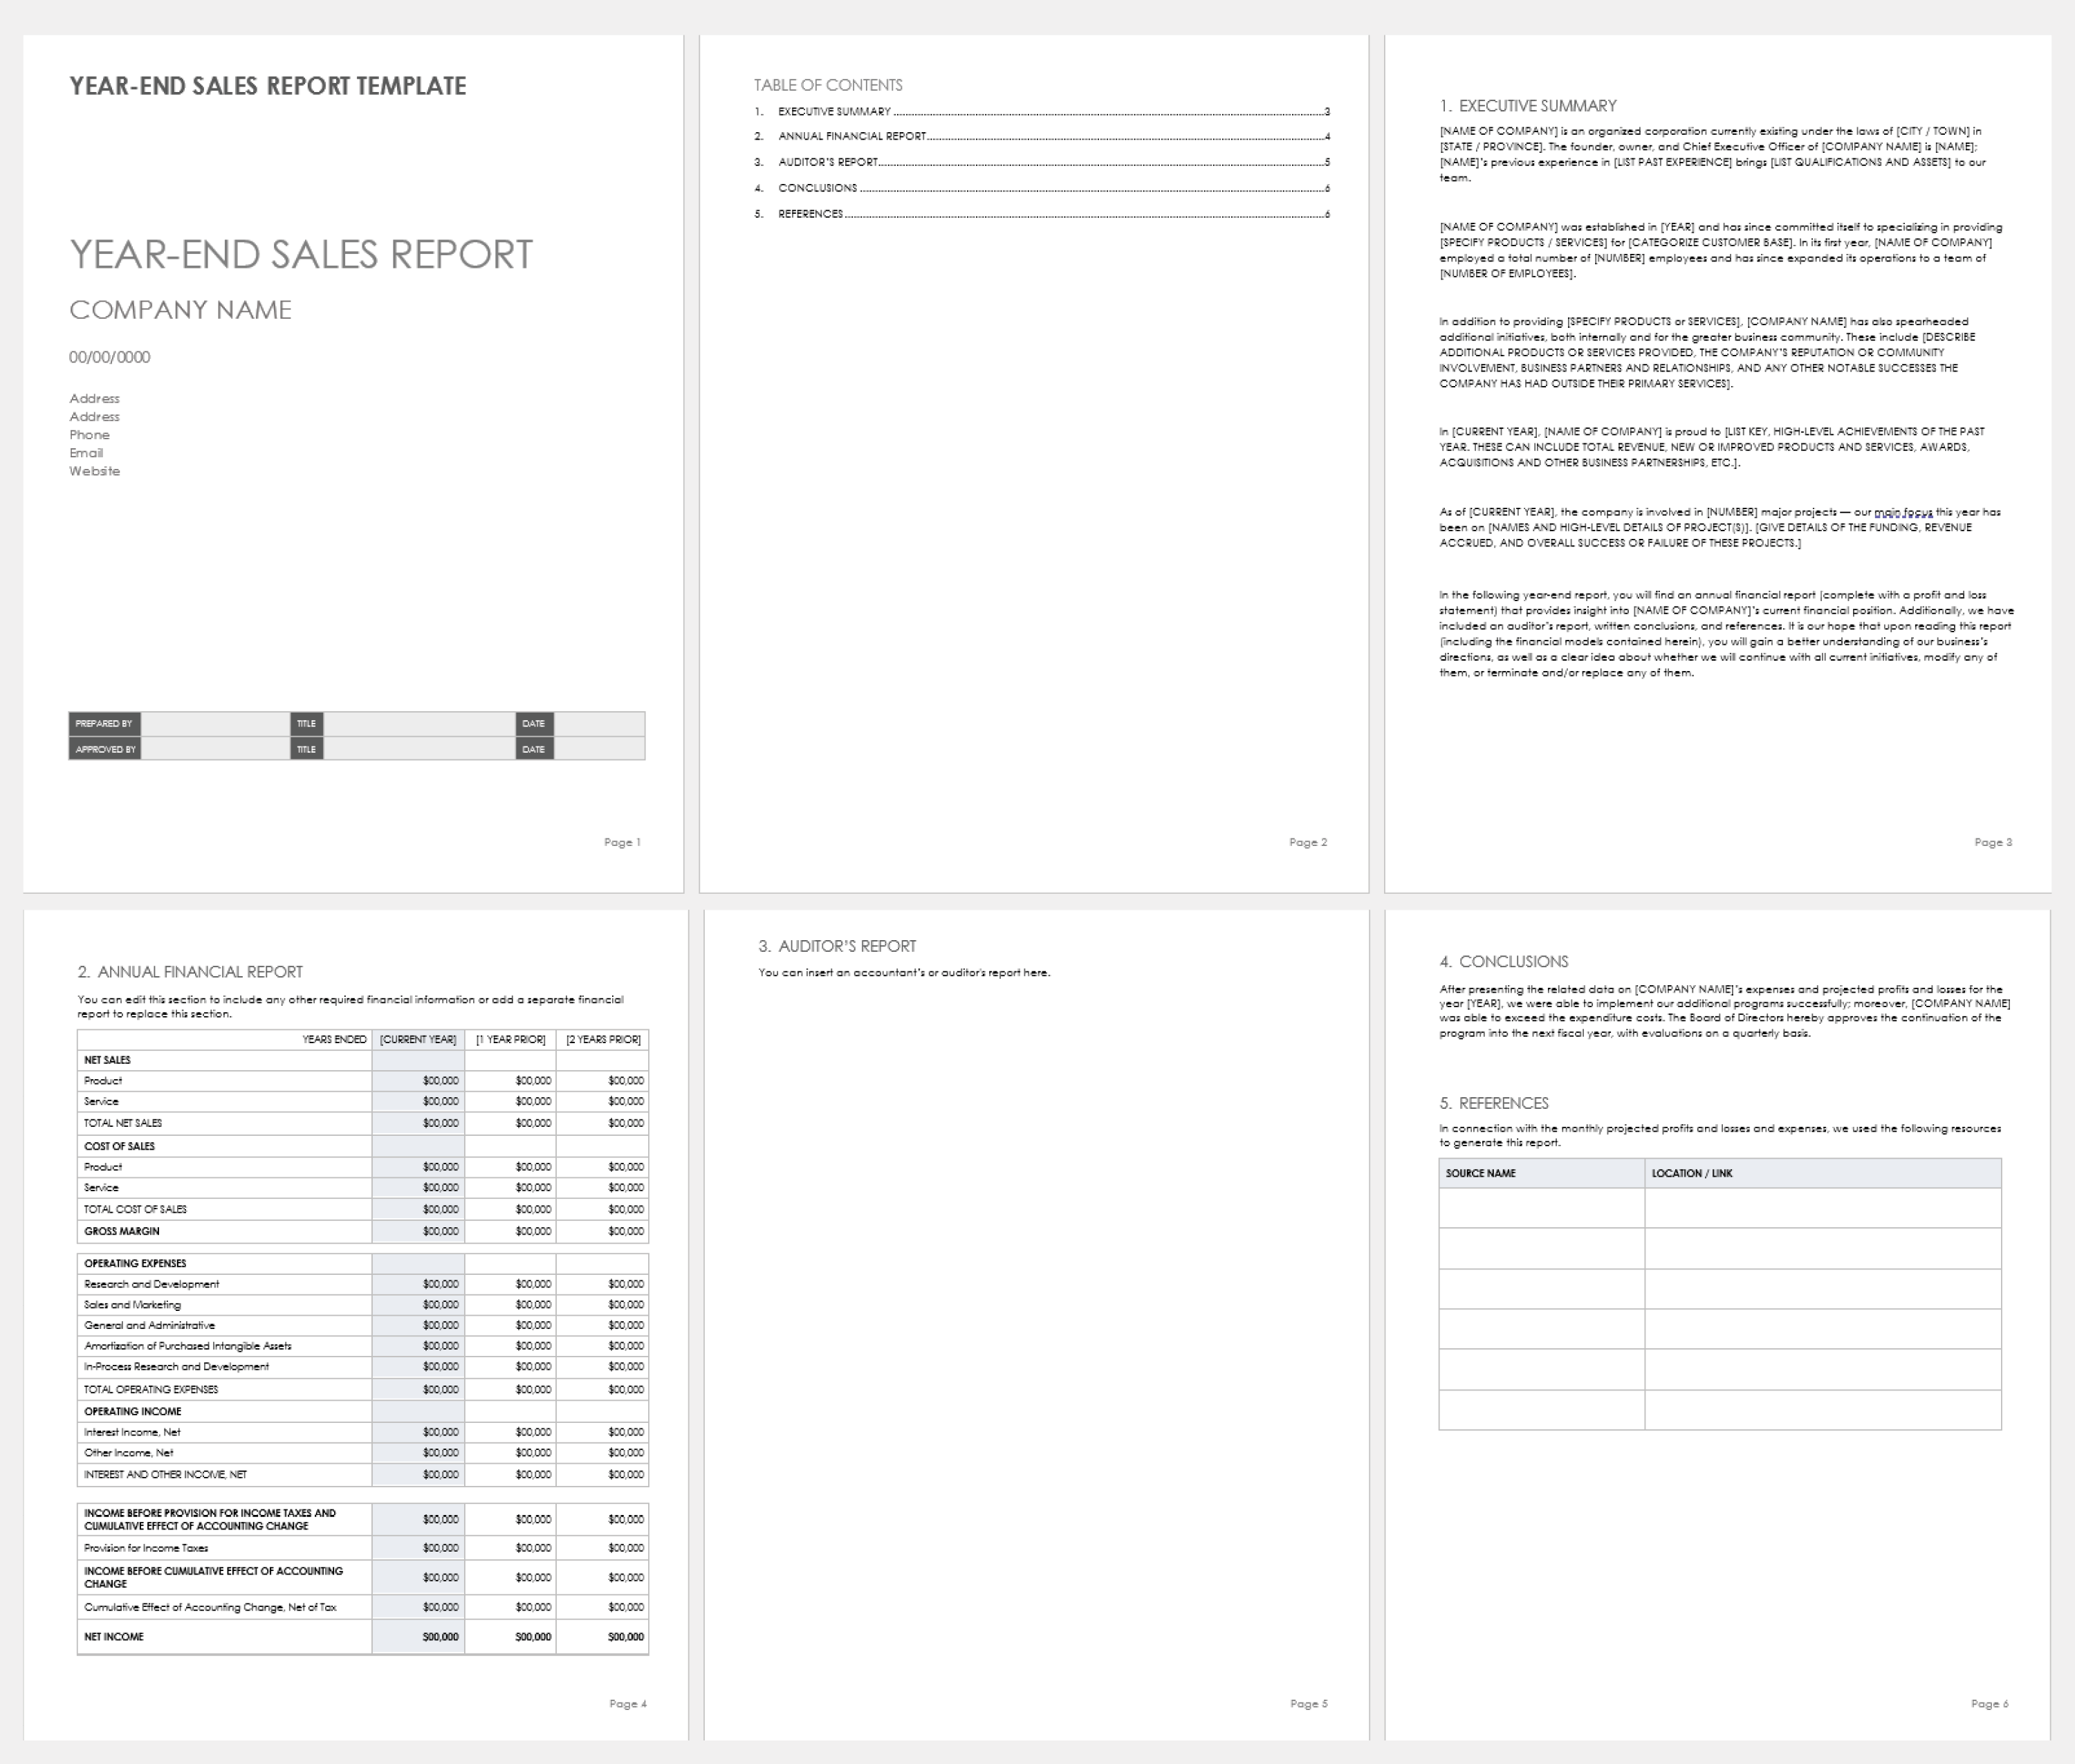
Create a comprehensive year-end sales report with this outline template, which is available in a document or slide format for presenting to stakeholders. The template includes sections for a table of contents, an executive summary, sales figures, an auditor report, a conclusion, and references. Edit the sample text to customize the template for your business, and use the preformatted tables to clearly present sales data for current and previous years.
Actual vs. Quota Annual Sales Report Sample
Download Actual vs. Quota Annual Sales Report with Sample Data
Microsoft Excel | Google Sheets
Download Blank Actual vs. Quota Annual Sales Report
Microsoft Excel | Google Sheets
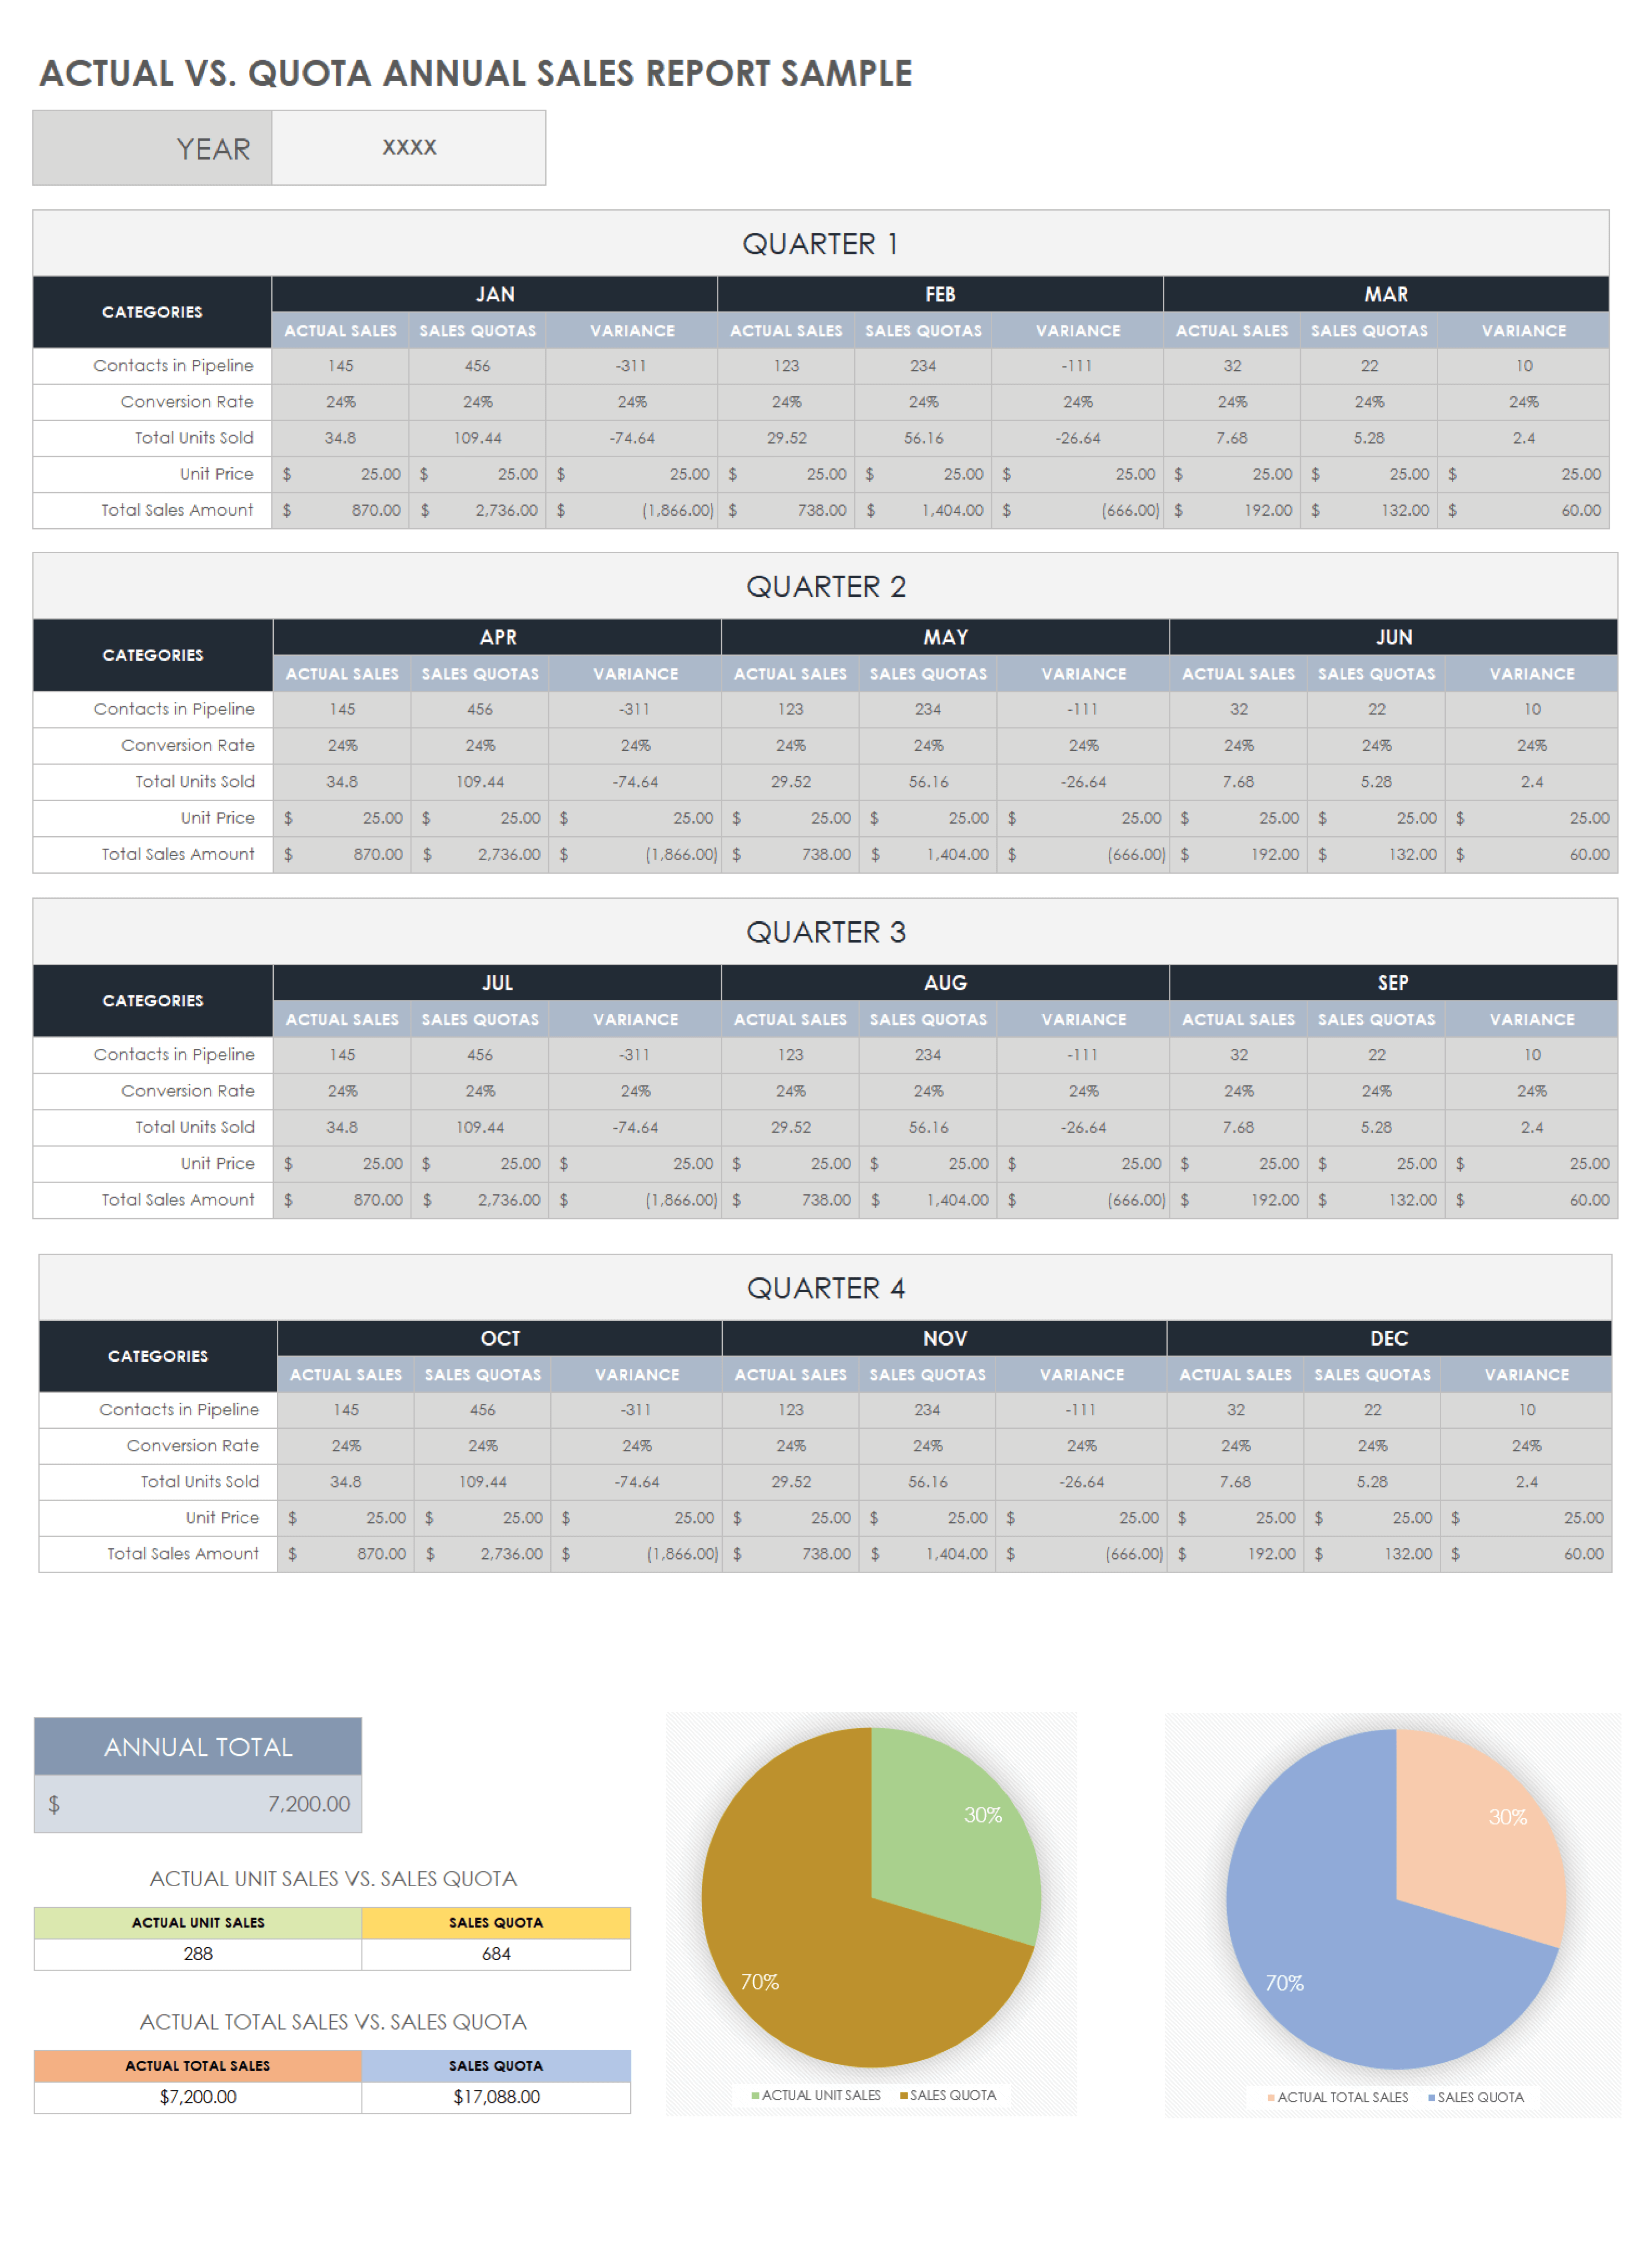
Compare your sales quotes to your actual sales figures to see how yearly sales performance differed from projected goals. This template provides a monthly and quarterly breakdown of data, including contacts in the pipeline, conversion rate, units sold, and sales revenue. The charts provide a snapshot of units sold and total revenue, so you can compare actual sales versus quotas for all 12 months. Plus, set data-informed sales quotas by tracking sales trends over time.
Annual Sales Rep Activity Report Template
Download Annual Sales Rep Activity Report Template — Microsoft Excel
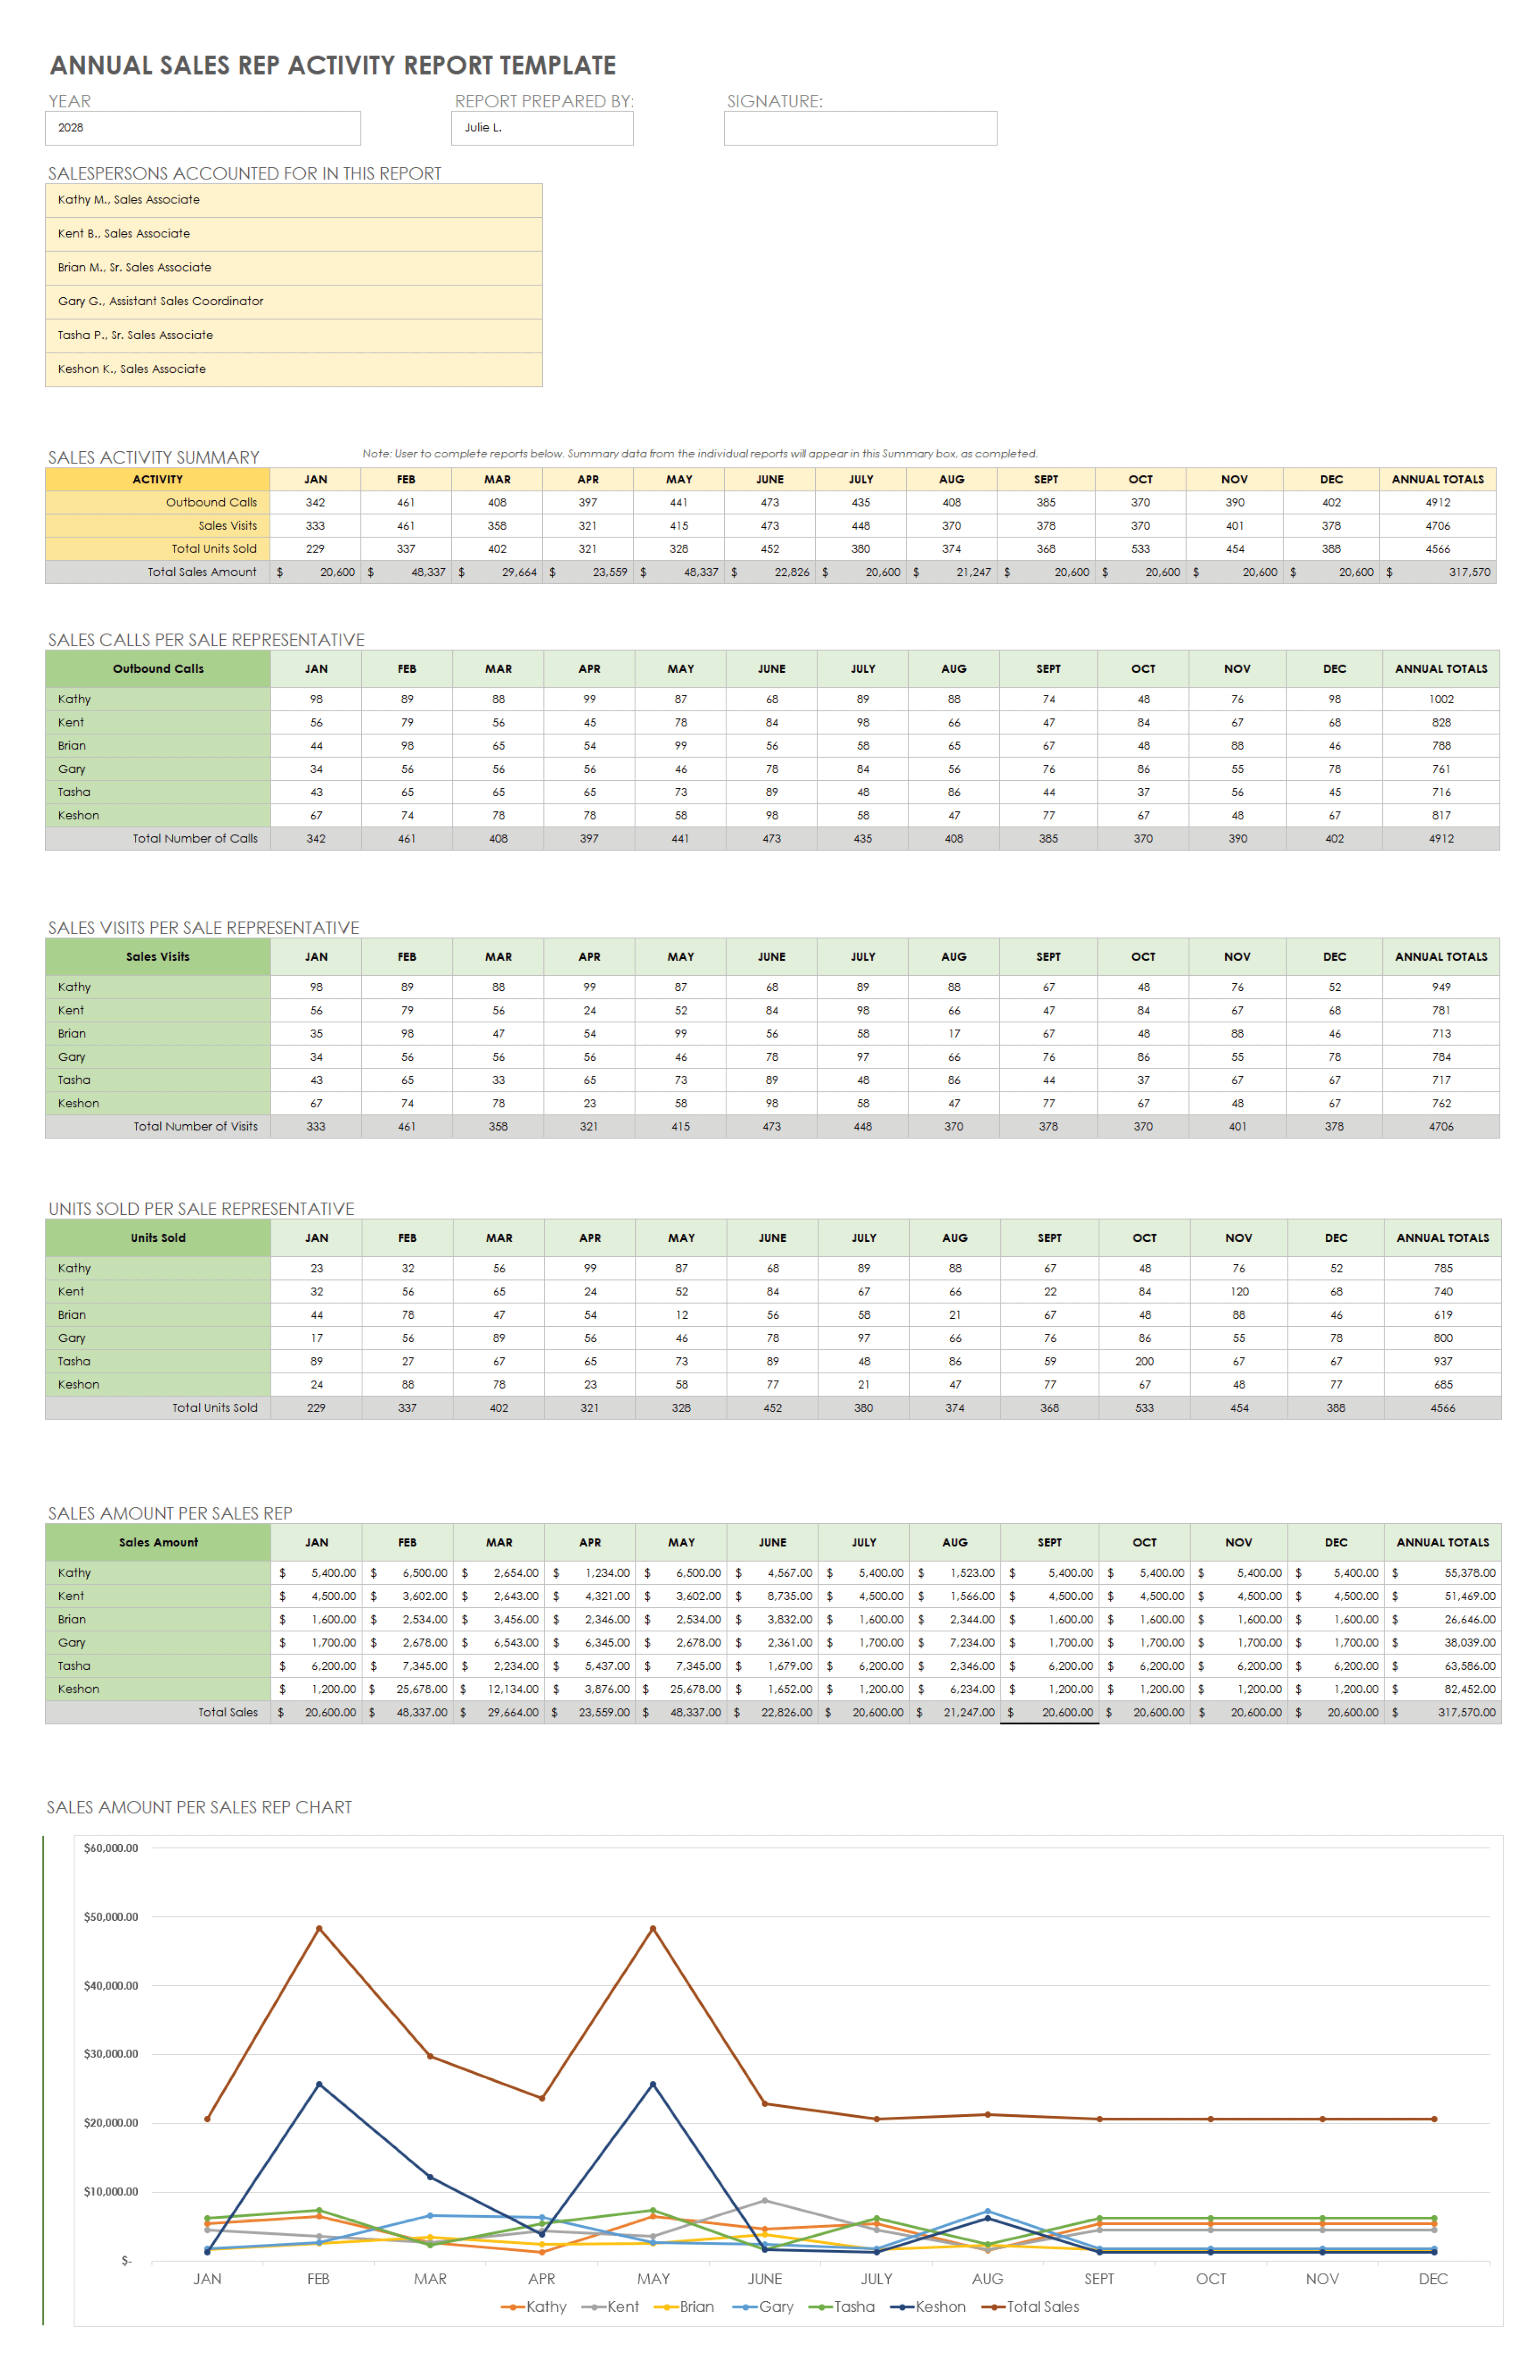
Use this template to create a yearly performance summary for your sales team as a whole and a breakdown for each sales representative. Enter your sales activity data, including the number of outbound calls, units sold, and total sales revenue, and get a quick overview of annual revenue per sales rep with a color-coded chart. Customize the template for your business by adding any sales activities you want to track and report on annually.
Yearly Sales Forecast Report Example Template
Download Yearly Sales Forecast Report Template with Example Data — Microsoft Excel
Download Blank Yearly Sales Forecast Report Template — Microsoft Excel
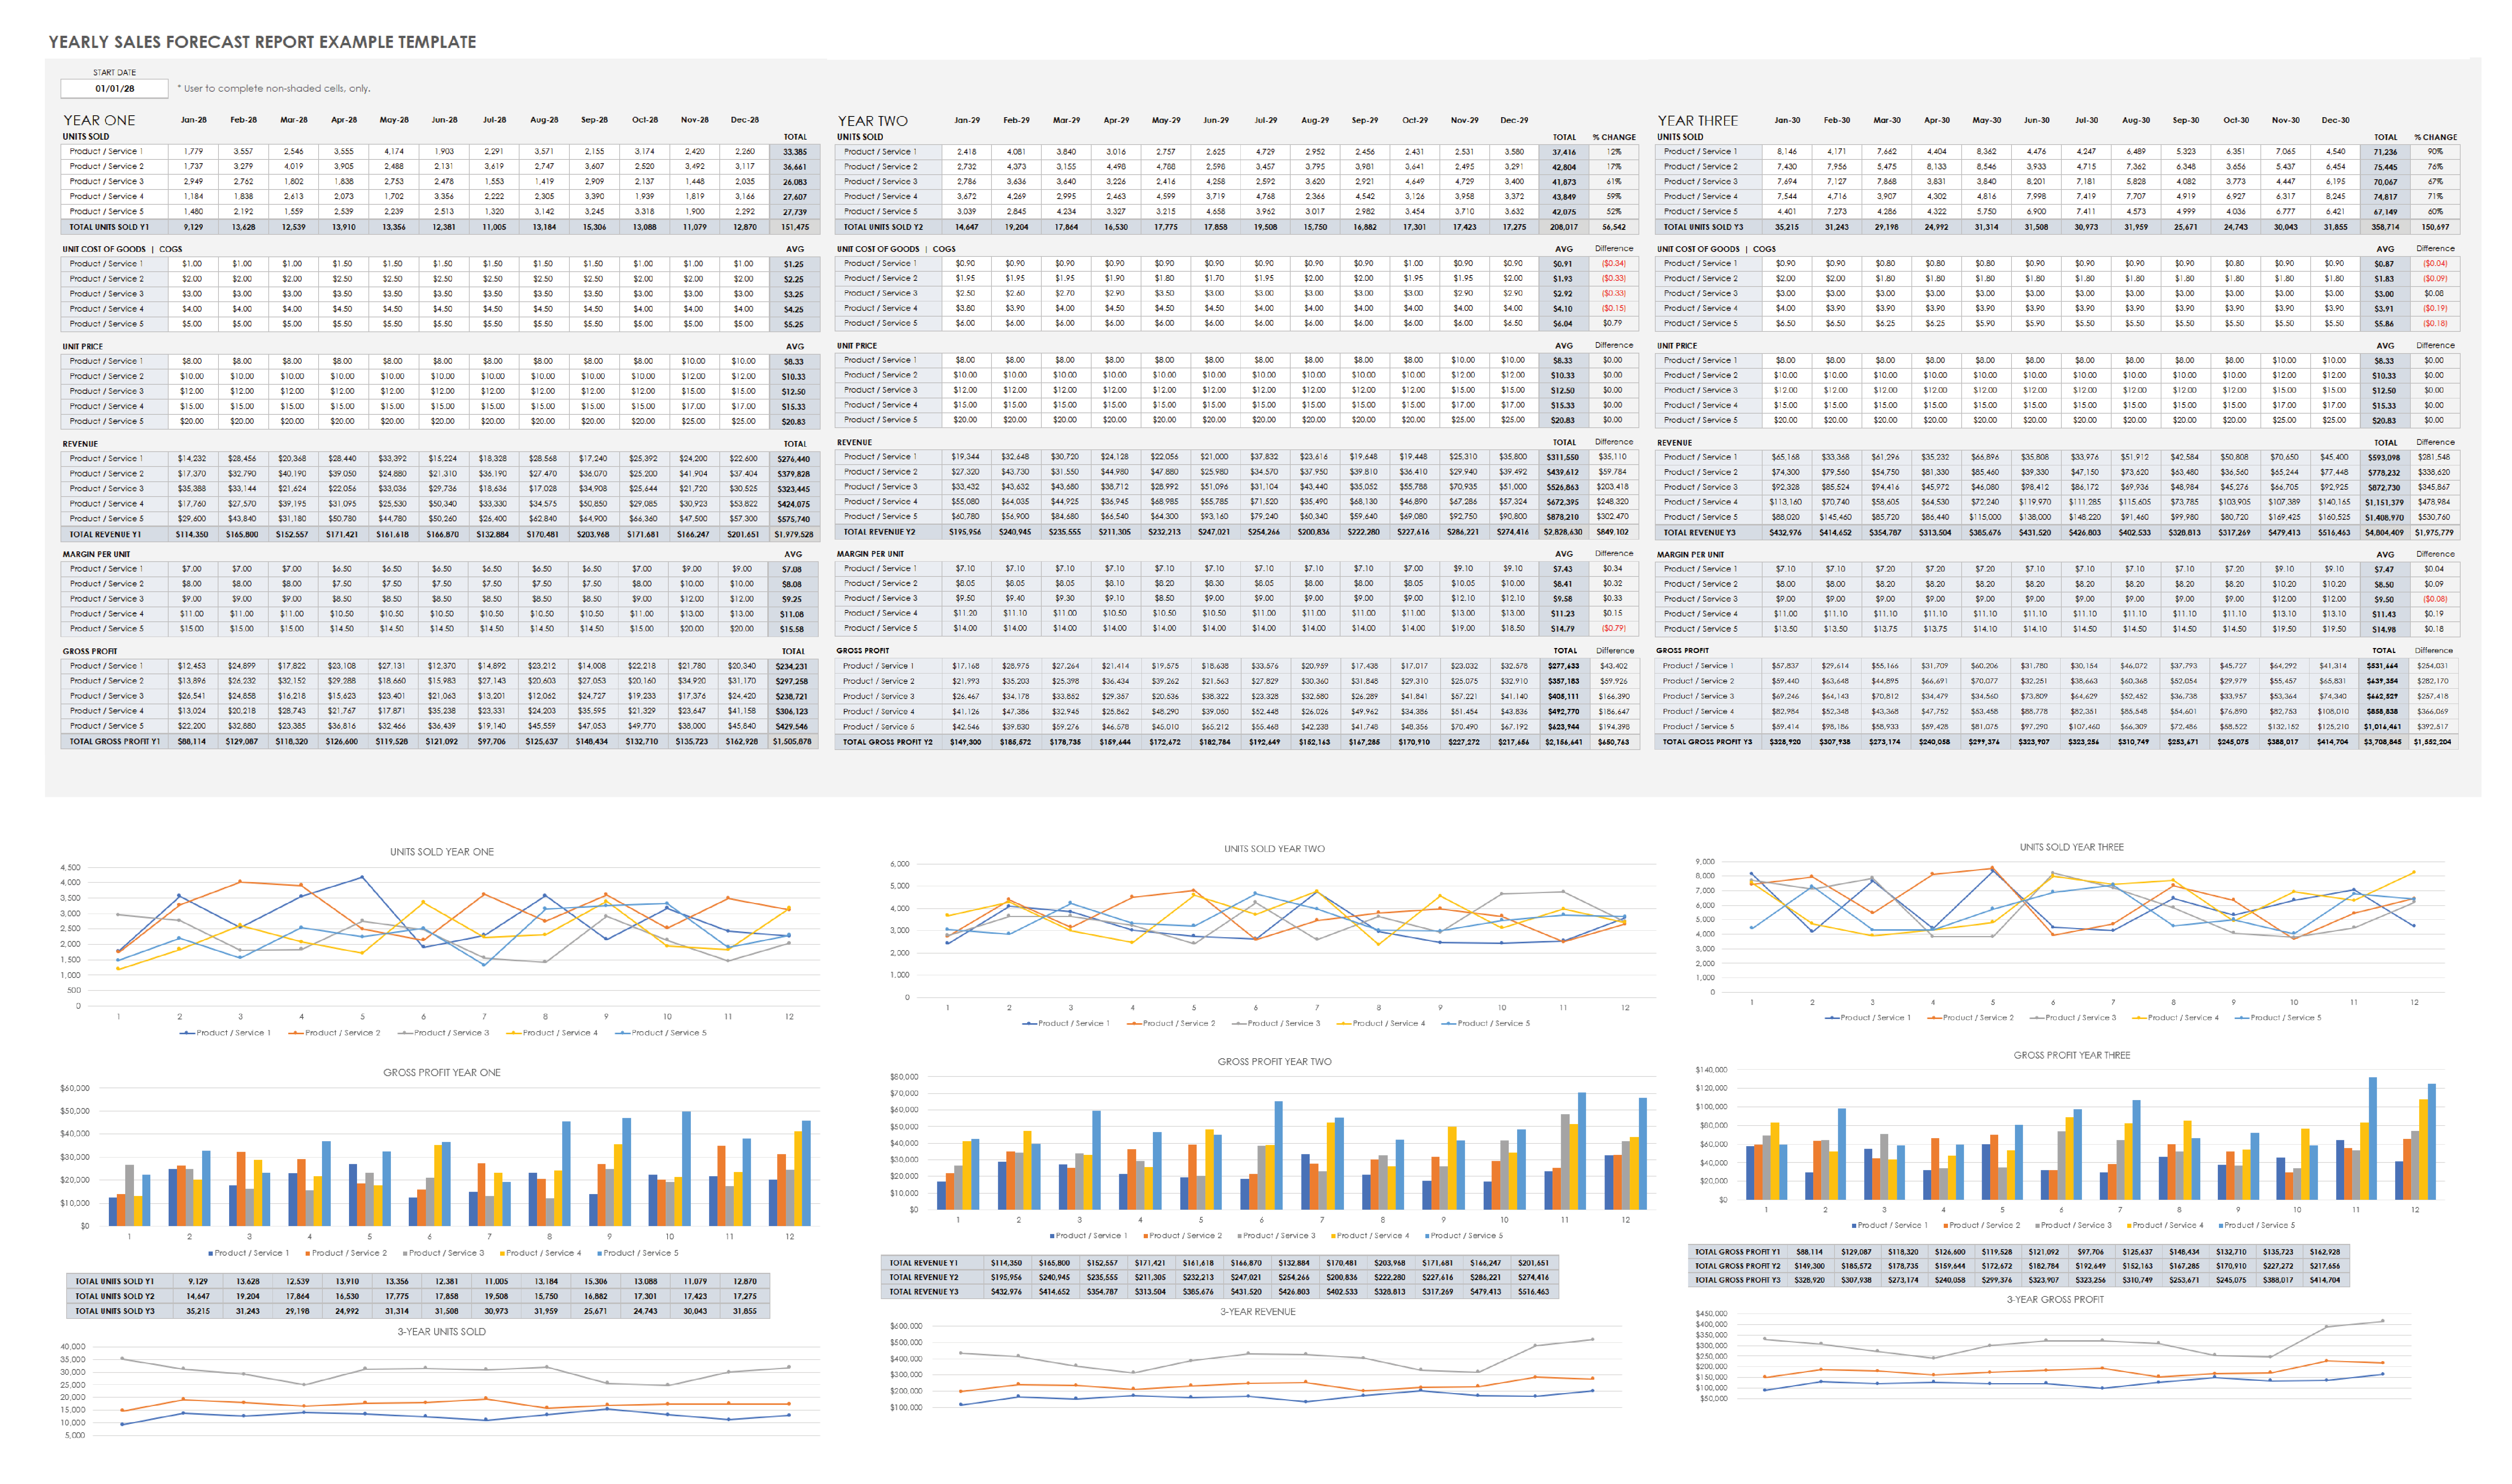
Use this template to forecast sales during a three-year time period. For each product or service listed, enter monthly amounts for price, units sold, and cost of goods sold (COGS). The template will automatically calculate revenue, margin per unit, and gross profit. Edit the date at the top of the template to update the months and years shown in the spreadsheet. Plus, the charts provide a visual summary of data, including a comparison of sales performance over the course of three years.
Annual Sales Report Dashboard Template
Download Annual Sales Report Dashboard Template — Microsoft Excel
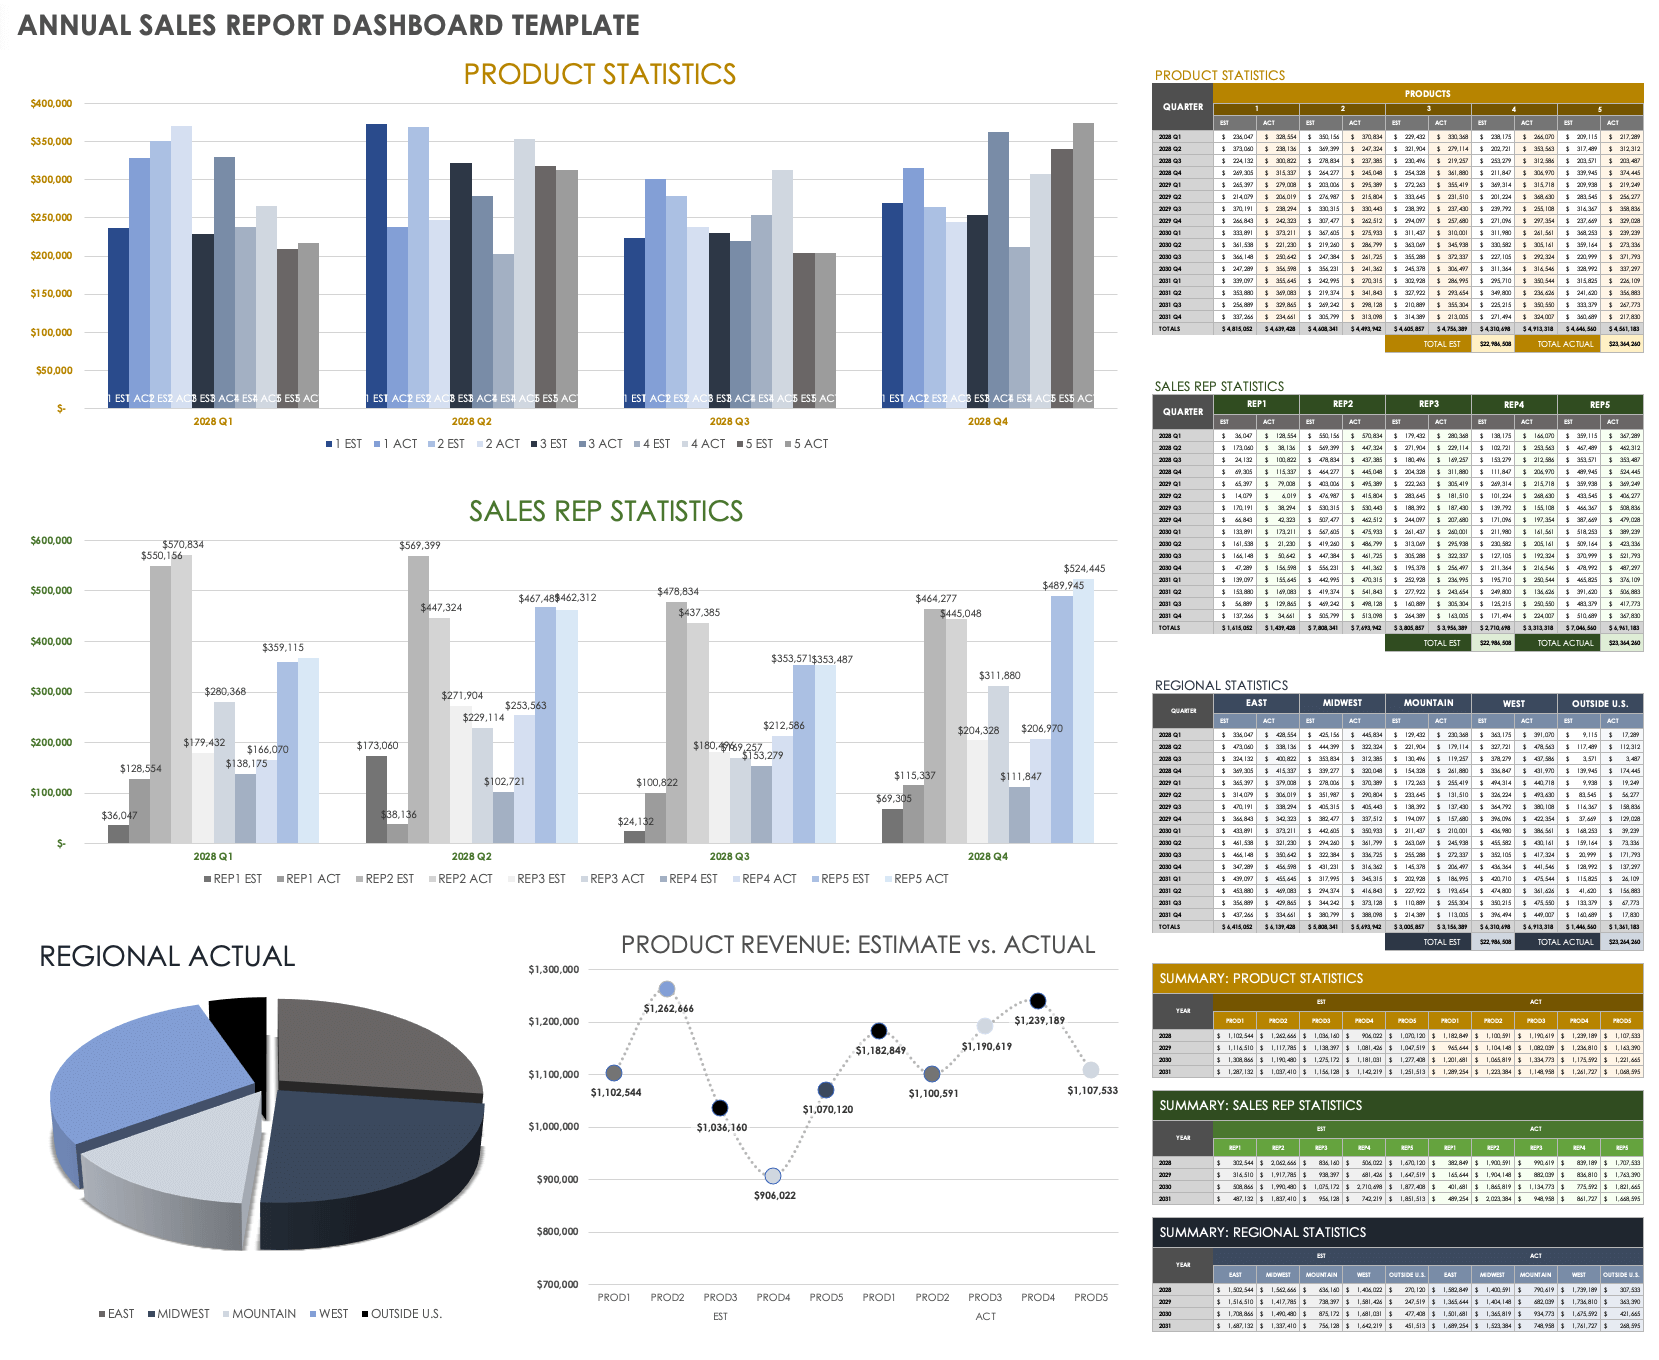
View sales key performance indicators (KPIs) in a dashboard format with this annual sales report template. Compare estimated versus actual sales performance by product, region, and salesperson. The template also provides an annual snapshot, with charts that show quarterly product sales and sales rep amounts, as well as annual revenue per product and region. Enter your data into the spreadsheet portion of the template to populate the dashboard, which you can use to update stakeholders on yearly sales performance at a glance.
Yearly Sales Comparison Report Template
Download Yearly Sales Comparison Report Template
Microsoft Excel | Microsoft PowerPoint
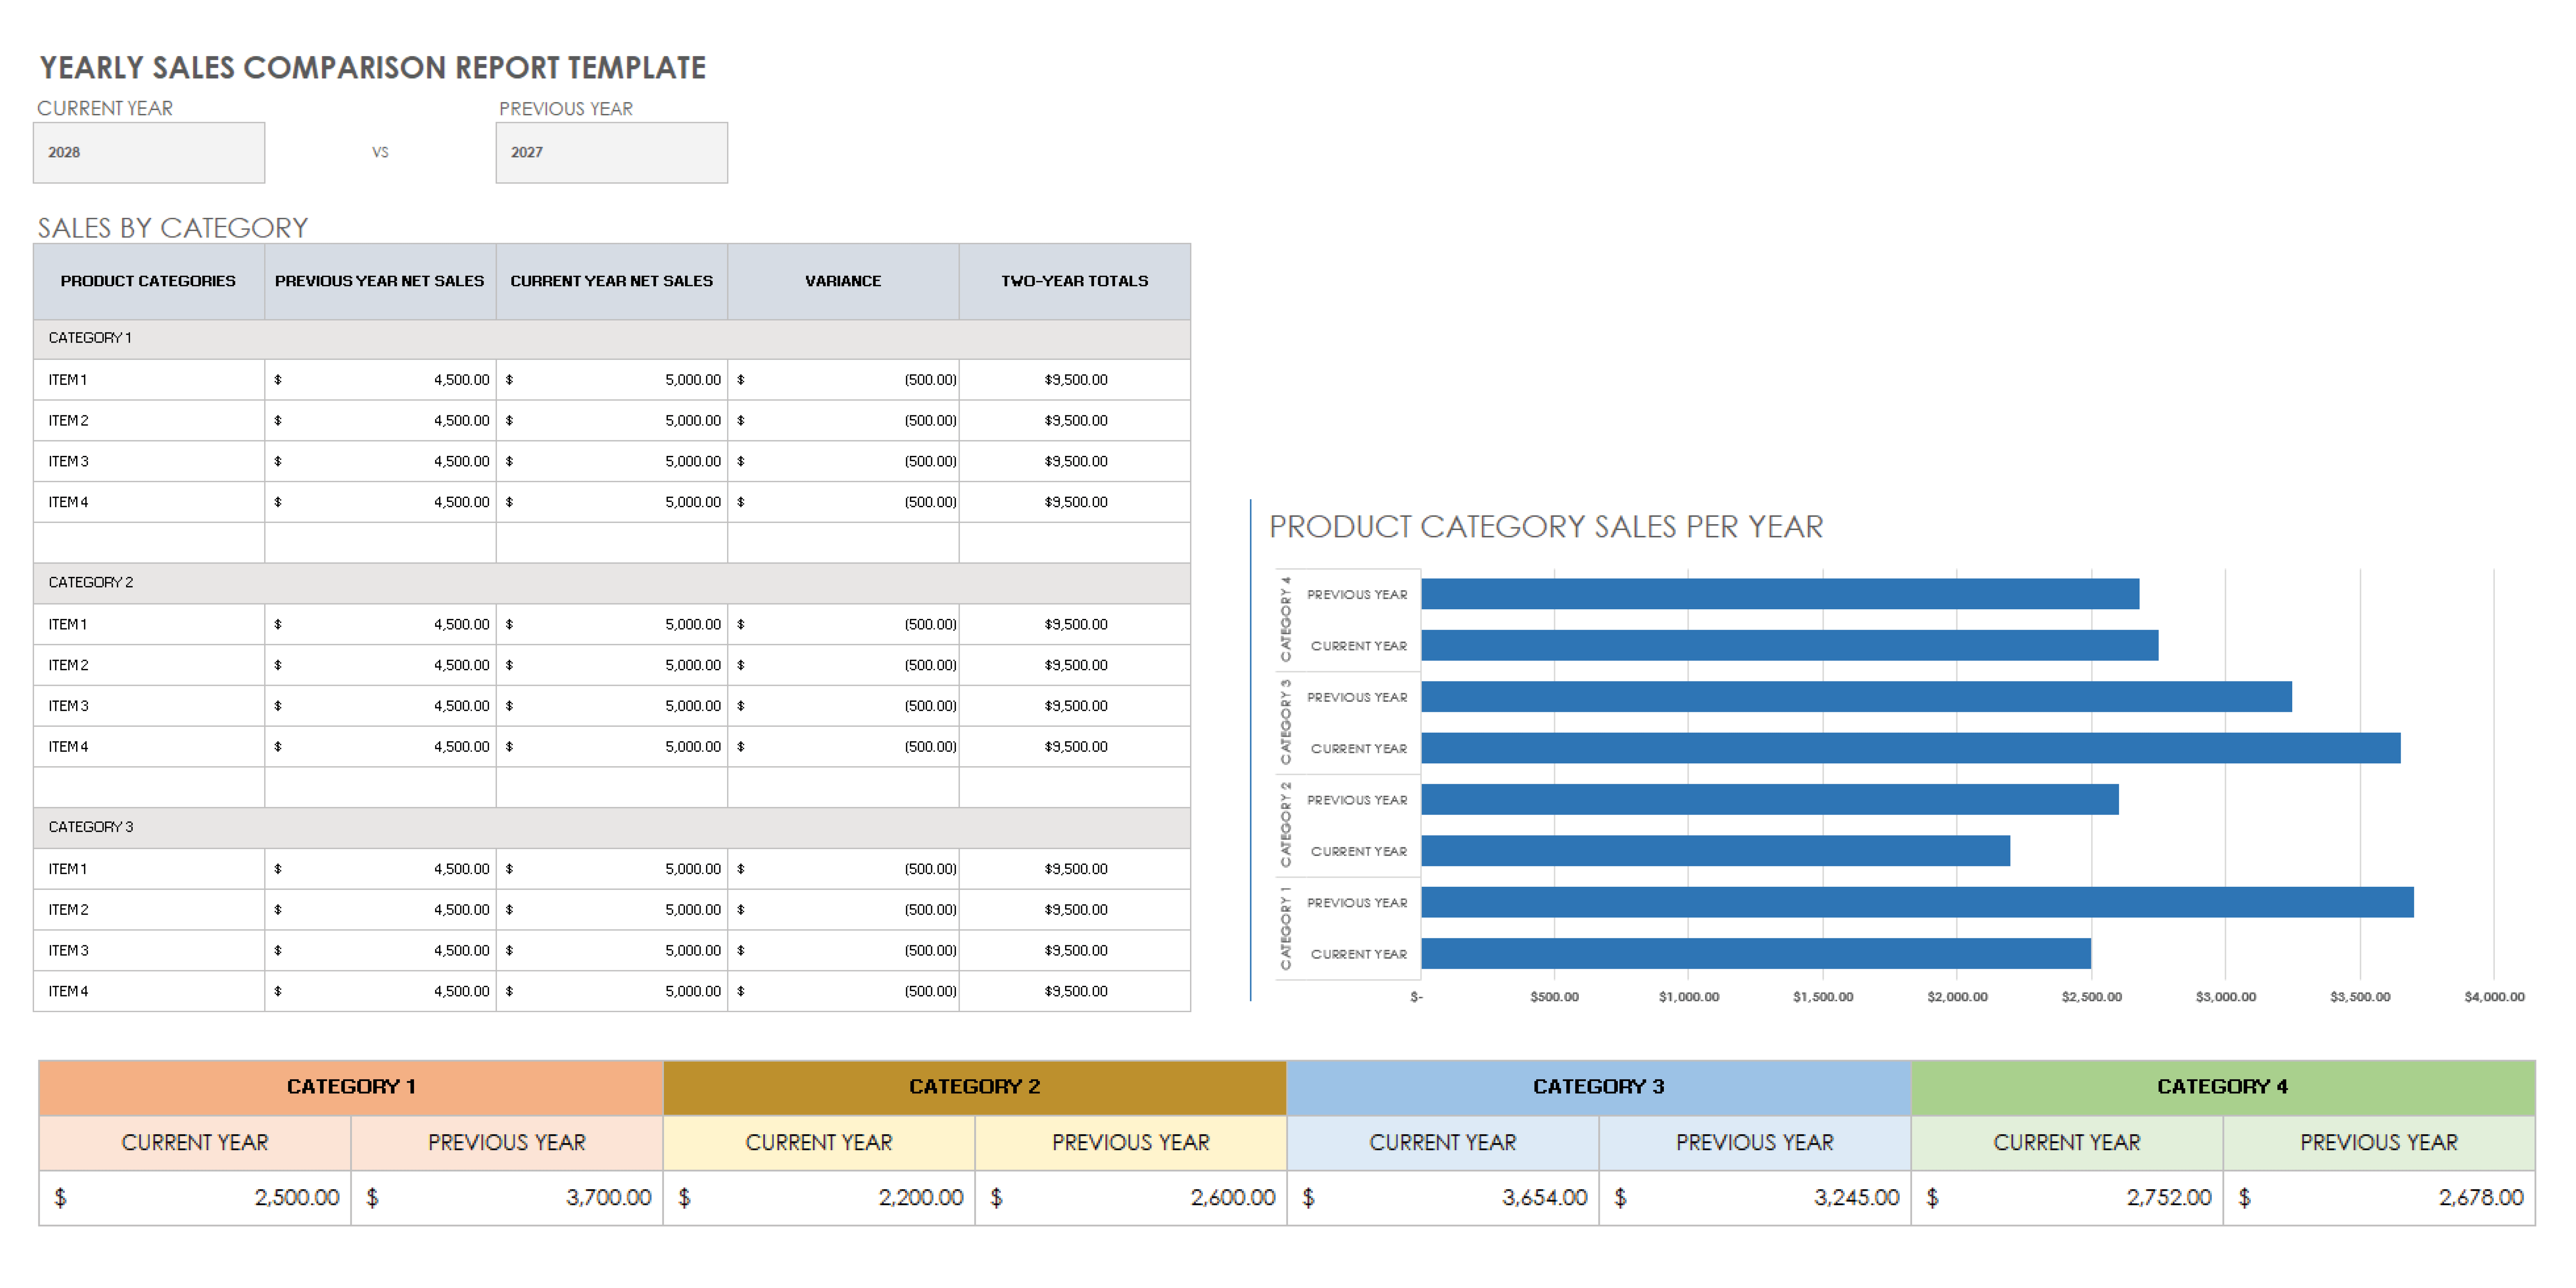
Evaluate product revenue with a year-over-year comparison of individual products and sales totals. Enter your product categories and merchandise in the first column, followed by annual net sales for each item. The template calculates the variance between products and yearly totals, and the built-in chart illustrates annual sales by product category for the current and previous year.
What Is Annual Sales?
Annual sales refers to a business' total amount of revenue generated over the duration of a year from the sale of its goods or services. It helps to indicate a company's financial performance by assessing its growth and profitability.
What Is an Annual Sales Report Template?
An annual sales report template covers sales activities and trends for a business or sales rep on a yearly basis. The report gives managers and other stakeholders insight into sales performance and helps inform future sales goals.
Yearly sales report templates provide an overview that relies on data collected for daily, weekly, and monthly sales reports.

